
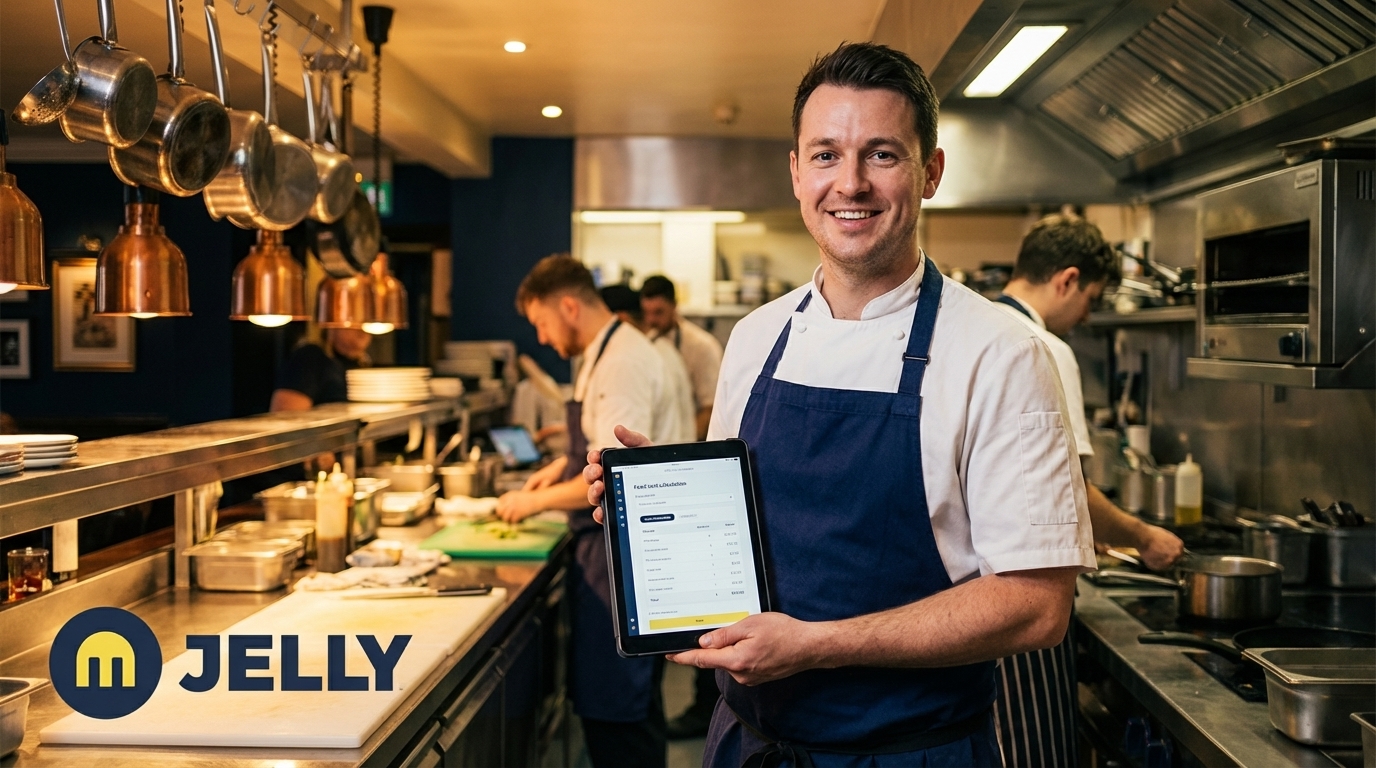
Written by: JJ Tan, Founder, Jelly | Last updated: 23 September 2026
Key Takeaways
- UK restaurant operators face widening gaps between expected and actual food costs due to volatile supplier prices, manual spreadsheets, and VAT complexity.
- A food cost calculator with inventory tracking combines recipe costing, stock movement, and sales data to deliver real-time gross profit margins using VAT-exclusive figures.
- Manual spreadsheets break down once operators exceed five suppliers, face weekly price changes, or manage multiple sites, leading to 10–20 hours of weekly admin and margin erosion.
- Key UK-specific requirements include VAT-exclusive reporting, Natasha’s Law allergen records for PPDS items, and HACCP-adjacent inventory documentation for compliance.
- Jelly automates invoice scanning, real-time dish costing, price alerts, and POS integrations to strengthen gross margins within the first three months.
The Problem: Why Manual Food Costing Fails UK Kitchens
The average UK kitchen deals with multiple suppliers, each delivering different ingredients at different rates, with prices that shift weekly. Industry estimates put food waste at 4–10% of purchases, and a variance of 5% or more between actual and theoretical food cost indicates a systemic problem. Costing a single dish in a spreadsheet takes an average of 28 minutes. Manual back-of-house admin, including price checking, inventory, and invoice reconciliation, can take 10–20 hours a week.
VAT complexity adds another layer. UK operators must separate VAT-exclusive supplier costs from VAT-inclusive guest prices. Applying the wrong rate across a high-volume operation compounds quickly into significant underpayments or overpayments. Waste tracking, allergen records, and multi-supplier reconciliation make the spreadsheet an increasingly fragile foundation.
The cost of ignoring this is margin erosion, missed supplier credits, and financial data that arrives too late to act on. Jelly addresses each of these failure points directly: automated invoice scanning removes manual data entry, real-time dish costing keeps GP margins current, and price alerts surface supplier changes the moment they happen. Flash reporting and POS integrations then turn that data into daily, weekly, or monthly GP visibility.
- Automated invoice scanning, with every line item captured via photo or email
- Real-time dish costing, with GP margins updating automatically when a new invoice arrives
- Price Alert, which flags every ingredient price increase or decrease by supplier
- Flash Report, giving a daily, weekly, or monthly GP margin view integrated with your POS
- Sales Mix, highlighting which dishes are most popular and most profitable
- POS integrations with Square, EPOS Now, Lightspeed, and Toast
- Accounting integrations with Xero, with Sage coming soon
Jelly onboards in the first week and runs at a flat rate of £129/month per location.
See how Jelly tracks your food costs
The Core Formula and a Worked UK Example
The standard food cost percentage formula is:
Food Cost % = (Beginning inventory + Purchases − Ending inventory) ÷ Food sales × 100
Where cost of ingredients used = Opening stock + Purchases − Closing stock.
For a VAT-exclusive UK example: a kitchen opens the week with £4,000 of stock (at net cost), receives £9,000 in purchases (VAT-exclusive, as shown on supplier invoices), and closes with £3,500 of stock. Cost of ingredients used = £9,500. Food sales for the week, excluding VAT, total £28,000. Food cost percentage = (£9,500 ÷ £28,000) × 100 = 33.9%.
All figures must be VAT-exclusive. Menu prices and till receipts are gross (VAT-inclusive). Margin, stock, and food cost analysis should use net (VAT-exclusive) figures, because input VAT on purchases is reclaimable by VAT-registered businesses. To extract the net figure from a VAT-inclusive supplier invoice, divide the gross by 1.20.
To calculate food cost per meal, list every ingredient with its exact recipe quantity, price each at the latest net invoice cost, and sum them to get the plate cost. For example, a dish built from a weighed portion of chicken breast, seasonal vegetables, and sauce components might come to a plate cost of around £1.40. If it sells at a net price of £12.00 (ex-VAT), the dish food cost percentage is (£1.40 ÷ £12.00) × 100 = 11.7%, and the gross profit margin is 88.3%. Add a Q factor of 2–4% of plate cost to cover garnish, condiments, and minor prep waste that recipes never fully capture.
With the formula clear, the next step is putting it into a working spreadsheet. The structure below keeps prices live and reduces manual updates.
How to Build It in Google Sheets or Excel
Structure the workbook across three tabs: Ingredients, Recipes, and Stock.
Tab 1 — Ingredients
Columns: Ingredient Name | Supplier | Pack Size | Pack Price (net, ex-VAT) | Unit | Cost Per Unit.
Formula for Cost Per Unit: =D2/C2 (Pack Price ÷ Pack Size). Update this column every time a supplier invoice shows a price change. All prices must be VAT-exclusive, so divide any VAT-inclusive figure by 1.20 before entering it.
Tab 2 — Recipes
Columns: Ingredient Name | Quantity Used | Unit | Cost Per Unit (linked from Tab 1) | Line Cost | Total Recipe Cost | Portions | Cost Per Portion | Selling Price (net) | Food Cost %.
Formula for Cost Per Unit (pulling from Ingredients tab): =VLOOKUP(A2,Ingredients!A:F,6,FALSE). Formula for Line Cost: =B2*D2. Formula for Total Recipe Cost: =SUM(E2:E20). Formula for Cost Per Portion: =G2/H2. Formula for Food Cost %: =(I2/J2)*100. Add a yield adjustment column: =IF(yield%<1, cost/yield%, cost) to account for trim and cooking loss on proteins and produce.
Tab 3 — Stock
Columns: Ingredient | Opening Stock (units) | Purchases (units) | Waste (units) | Closing Stock (units) | Used (formula) | Cost Per Unit | Total Cost Used.
Formula for Used: =B2+C2-D2-E2. Formula for Total Cost Used: =F2*G2. Sum the Total Cost Used column for your period COGS. Divide by VAT-exclusive food sales and multiply by 100 for your actual food cost percentage.
The three tabs link as follows. Tab 2 pulls live unit costs from Tab 1 via VLOOKUP, so updating a supplier price in Tab 1 recalculates every recipe that uses that ingredient. Tab 3 uses the same unit costs from Tab 1 to value stock movements. Hardcoding prices in recipe sheets instead of linking to an ingredient database means updating every recipe manually when prices change, and the VLOOKUP structure prevents this.
What Is the 30/30/30 Rule for Restaurant Food Costs?
The 30/30/30 rule states that a healthy restaurant runs roughly 30% food cost, 30% labour cost, and 30% overhead, leaving about 10% as net profit. The rule is commonly traced to benchmarks such as the National Restaurant Association’s Restaurant Industry Operations Report and parallel foodservice distributor data from the late 1980s and 1990s, though some sources attribute its popularisation to 1990s casual dining chains. It emerged when full-service restaurants operated without delivery app commissions, technology subscription fees, or the post-pandemic wage environment.
For UK operators in 2026, the rule functions as a diagnostic rather than a target. With energy costs, National Living Wage increases, and food inflation squeezing margins, many UK restaurant operators are working hard just to land in the 5–8% operating profit range rather than the 10% the 30/30/30 rule targets.
A worked UK example: a restaurant turning over £80,000 per month with food cost at 33%, labour at 34%, and occupancy and other operating costs at 26% has a combined cost of 93%, leaving a residual of 7% — about £5,600 per month — before interest, tax, depreciation and amortisation. That is a reasonable outcome in the current environment, but one that leaves no room for food cost drift. Operators who consolidate vendors and conduct a single weekly inventory variance review routinely keep food cost 1.5 to 2.5 percentage points lower than peers.
Use the 30/30/30 rule to identify which bucket is leaking. If food cost is running at 36% and labour is at 30%, the food cost bucket is the priority. If all three are at 30% but profit is below 5%, technology and platform fees, a category that now runs 4–6% of revenue for most UK operators, are likely the culprit.
Inventory Tracking Mechanics: Opening Stock to Closing Stock
Accurate inventory tracking requires four data points per period: opening stock, purchases, waste, and closing stock. The formula for cost of ingredients used is: Opening Stock + Purchases − Closing Stock = Ingredients Used. Waste should be recorded separately and subtracted before closing stock is counted, so that spoilage and over-portioning are visible rather than buried in the closing figure.
Actual vs theoretical food cost is the most important diagnostic in food costing. Theoretical food cost is what the kitchen should have spent, calculated from recipe costs multiplied by portions sold via POS data. Actual food cost is what the inventory formula says really happened. A healthy food cost variance is under 2 to 3 percent; a variance of 5 percent or more indicates a systemic problem.
The three root causes of persistent variance are stale recipe costs (ingredient prices updated on invoices but not in recipe cards), unrecorded spoilage (stock discarded without a waste log entry), and portion inconsistency (kitchen staff plating over spec). Even a small over-portion on a high-volume dish can add up to a significant monthly food cost at a single site.
Inventory turnover measures how quickly stock is being used relative to what is held. A higher turnover rate reduces spoilage risk and ties up less cash in stock. Calculate it as: Cost of Ingredients Used ÷ Average Inventory Value. For a kitchen spending £9,500 on ingredients against an average stock value of £3,750, inventory turnover is 2.5 times per period. Weekly stock counts on high-value items such as proteins, premium spirits, and seasonal produce catch variance before it compounds.
UK-Specific Requirements Your Calculator Must Handle
VAT-exclusive reporting is non-negotiable for UK operators. Hot food and drink consumed on premises is standard-rated at 20%, hot takeaway food and drink is standard-rated at 20%, and cold takeaway food not eaten on premises is zero-rated at 0%. A single operation can apply different VAT rates to different supplies. Applying the wrong rate to any of them compounds quickly across a high-volume service. All food cost calculations must use net (ex-VAT) figures for both ingredient costs and food sales. To remove VAT from a gross figure: Net = Gross ÷ 1.20.
Natasha’s Law allergen records require that any food prepacked for direct sale (PPDS), meaning food packaged on the same premises before the customer orders it, carries a full ingredients list with the 14 regulated allergens emphasised within that list. This applies to sandwiches, salads, bakery products, and any item wrapped before service. Your inventory and recipe system must record allergen information at ingredient level so it flows through to dish and label level accurately.
HACCP-adjacent inventory records are a legal requirement under UK food hygiene rules, which require businesses to maintain a documented food safety management system based on HACCP principles. Records that support a due-diligence defence include supplier delivery records, temperature logs, and use-by date records for high-risk items. Allergen information linked to stock items and recipes, plus traceability records, also count. These records must be contemporaneous, completed at the time rather than reconstructed later.
US-based food cost calculators and templates typically omit VAT handling entirely, do not distinguish between PPDS and non-prepacked allergen requirements, and use US-style sales tax logic that does not apply in the UK. Any template sourced from a US provider requires significant adaptation before it is compliant for UK use.
Jelly works alongside complementary tools including Square, EPOS Now, Lightspeed, Toast, Xero, and Sage to create a connected operational stack for UK operators.
The Spreadsheet Breaking Point
Spreadsheets fail silently. An out-of-date spreadsheet looks identical to a current one, so pricing and menu decisions continue to be made on data that no longer reflects reality. The core difference between a spreadsheet and connected costing software is where the price comes from. In a spreadsheet the price is a historical figure typed the day the sheet was built. In a connected system it comes from the delivery note that arrived that morning.
The operational triggers that break a spreadsheet-based system are well-defined:
- 5+ suppliers with variable prices, especially fresh, seasonal, or market produce
- Weekly price changes, because each change requires manual updates across every recipe using that ingredient
- Multi-site operations, where a shared master sheet can only hold one price per ingredient, hiding overpaying sites
- 28-minute dish costing, the typical time to cost a single menu item in a spreadsheet
- 10–20 hours per week on manual data entry, price checking, and invoice reconciliation
- More than one person editing the file, which causes formula corruption and version conflicts
- Chained in-house preparations, where sauces, stocks, and doughs costed separately and used across multiple dishes break cross-tab references when rows are inserted or moved
Before using Jelly, Chef Murat Kilic of Amber restaurant relied on tedious manual costing and pricing with spreadsheets. Volatile supplier pricing and manual invoice work were eroding margins. Costing dishes in spreadsheets made it hard to see price changes quickly, negotiate with suppliers, or adjust menu pricing in time to protect GP. After implementing Jelly, Amber now saves £3,000–£4,000 per month, which represents approximately 68× ROI.
Sushi Revolution’s monthly stocktake using Jelly takes 5–20 minutes, down from 2–3 hours previously.
Spreadsheet Vs Software: A Qualitative Comparison
The table below compares spreadsheets and dedicated software across the operational triggers that most often break a manual system, including setup, supplier count, price changes, multi-site support, VAT, allergens, POS, and accounting.
| Criterion | Spreadsheet | Dedicated Software |
|---|---|---|
| Setup time | Low initial effort, with significant ongoing maintenance as menus and suppliers grow | Onboards in the first week, with ongoing maintenance largely automated |
| Supplier count | Manageable with one broadline distributor and under about eight locations on a single concept; becomes error-prone as supplier and distributor complexity grows | Handles unlimited suppliers; invoice scanning captures every line item automatically |
| Price change frequency | Each change requires manual updates across every affected recipe | Price changes propagate automatically to all recipes using that ingredient |
| Multi-site support | Requires separate files per site, with no consolidated view and common version drift | Single platform across all sites, with location-level and group-level visibility |
| VAT handling | Manual, requiring the operator to apply correct VAT logic to every formula | VAT-exclusive calculations built in, with net figures used throughout |
| Allergen tracking | Maintained separately, not linked to live recipe data, and prone to becoming stale | Allergen data linked to ingredients and flowing through to dish and label level |
| POS integration | None; sales data must be exported and re-keyed manually | Real-time API integration, with item-level sales data updating margins automatically |
| Accounting sync | Manual export and re-entry into accounting software | One-click push to Xero, with Sage integration coming soon |
What to Look for in Food Costing Software for UK Restaurants
When evaluating food costing software for a UK operation, the checklist should cover:
- Recipe costing, with live dish costs that update automatically when ingredient prices change, including yield and wastage
- Invoice capture, with automated scanning of every line item from supplier invoices by photo or email
- POS integration, with real-time API connection to your till system for live sales mix and GP margin data
- Accounting sync, with direct integration with Xero or Sage to eliminate manual bookkeeping
- VAT-exclusive reporting, with all cost and margin calculations using net figures
- Allergen records, with ingredient-level allergen data that flows through to recipe and PPDS label level
- Price alerts, with instant notification of supplier price changes by ingredient and by supplier
- Multi-site support, with location-level and group-level visibility from a single platform
Frequently Asked Questions
Is There a Free Food Cost Calculator for UK Restaurants?
Free static templates are available from suppliers and industry bodies, and the three-tab Google Sheets structure described in this article can be built at no cost. These tools work well for a single site with a short, stable menu and a small number of suppliers whose prices rarely change. The limitation is maintenance: every supplier price change requires manual updates across every affected recipe, and there is no automatic link to POS sales data or accounting software. For operators with more than five suppliers, weekly price changes, or more than one site, the time cost of maintaining a free spreadsheet typically exceeds the subscription cost of dedicated software within a few months.
How Do I Calculate Food Cost in Excel?
Build three linked tabs: Ingredients (with net, VAT-exclusive unit costs), Recipes (using VLOOKUP to pull live costs from the Ingredients tab), and Stock (tracking opening stock, purchases, waste, and closing stock). The core formula is Food Cost % = (Opening Stock + Purchases − Closing Stock) ÷ Food Sales × 100, using VAT-exclusive figures throughout. Update the Ingredients tab every time a supplier invoice shows a price change, which will automatically recalculate all recipe costs via VLOOKUP. Count stock on the same day each week, before the main delivery, to ensure consistency.
What Is the 30/30/30 Rule?
The 30/30/30 rule is a financial benchmark that allocates 30% of restaurant revenue to food cost, 30% to labour, and 30% to overheads, leaving 10% as net profit. It is commonly traced to benchmarks such as the National Restaurant Association’s Restaurant Industry Operations Report and parallel foodservice distributor data from the late 1980s and 1990s, though some sources attribute its popularisation to 1990s casual dining chains. In the current UK environment, with National Living Wage increases, energy costs, and food inflation, many operators land in the 5–8% operating profit range rather than the 10% target. The rule is most useful as a diagnostic: if any of the three buckets exceeds 30%, that is the priority area to investigate.
What Are the 7 Menu Pricing Methods?
The seven principal menu pricing methods are:
- Food cost percentage pricing, where the menu price is set by dividing plate cost by a target food cost percentage.
- Contribution margin pricing, where a fixed gross profit per cover is added to plate cost.
- Competitive pricing, where prices are set relative to comparable local operators.
- Psychological pricing, where prices are set at points that feel lower to guests, such as £11.95 rather than £12.00.
- Demand-based pricing, where prices vary by time of day, day of week, or season.
- Bundle pricing, where dishes are grouped into set menus or meal deals at a combined price.
- Value-based pricing, where prices reflect the perceived value of the experience rather than the cost of ingredients.
Most UK operators use a combination of food cost percentage pricing as a floor and competitive or value-based pricing as a ceiling.
How Does VAT Affect Food Cost Calculation?
UK VAT rules mean that hot food and drink consumed on premises is standard-rated at 20%, while cold takeaway food not eaten on premises is zero-rated at 0%. For food cost calculations, all figures, both ingredient costs and food sales, must be VAT-exclusive (net). Supplier invoices show VAT as a separate line; divide the gross figure by 1.20 to get the net cost. Till receipts include VAT in the total; divide by 1.20 to get net sales. VAT-registered businesses reclaim input VAT on purchases, so VAT is neither a cost nor income and must be stripped out of all margin and costing calculations.
What Is the Difference Between Actual and Theoretical Food Cost?
Theoretical food cost is what the kitchen should have spent, calculated by multiplying the recipe cost of each dish by the number of portions sold from POS data, assuming perfect portioning, no waste, no spoilage, and no theft. Actual food cost is what the inventory formula says really happened: Opening Stock + Purchases − Closing Stock, divided by food sales. The gap between the two is food cost variance. A variance under 2–3 percentage points is normal operational noise. A persistent gap above 5 percentage points indicates a structural problem, typically stale recipe costs, unrecorded spoilage, or portion inconsistency. On £50,000 of monthly food sales, a 3-point variance represents £1,500 lost every month, which annualises to £18,000 per year when calculated as 12 monthly periods (some operators instead annualise by multiplying the period figure by 52 weeks).
Conclusion: From Spreadsheet to System
A spreadsheet food cost calculator with inventory tracking will get a UK restaurant, pub, or boutique hotel operator started. It will handle a small menu, a handful of suppliers, and a single site for a period of time. The moment a supplier raises a price, a new site opens, or a second person starts editing the file, the spreadsheet begins to drift. It looks current. It is not.
Jelly replaces that drift with live, VAT-exclusive dish costs, automated invoice scanning, and real-time GP margins, from £129/month per location. It onboards in the first week, connects to Square, EPOS Now, Lightspeed, Toast, Xero, and Sage, and strengthens gross margins in the first three months. Operators including Amber, The Howard Arms, and Cafe Murano use Jelly, with customers describing the shift from flying blind to being on top of their costs.
A spreadsheet can carry a small, stable operation. Jelly is built for the point where supplier prices, menu size, or site count outgrow it.

