
Written by: JJ Tan, Founder, Jelly
Key Takeaways
- Portion control in UK commercial kitchens is a measurement system. It requires standardising, measuring, auditing and reconciling every ingredient leaving the pass.
- Recipe costs must be calculated on served weight after yield, trim and wastage. Relying on raw supplier weight understates plate costs on proteins and other high-value items.
- Set ingredient-specific variance tolerances: ±5 g for proteins, ±10% for sauces and starches, and tighter ±2–3% for cheese and premium oils. Audit weekly against these targets.
- Weekly portion audits with a named owner, calibrated scales and documented variance logs catch drift before it compounds into thousands of pounds of annual loss.
- Jelly automates invoice-to-plate reconciliation, live costing and price alerts so operators can protect margins without manual spreadsheets or delayed reporting.
See how Jelly automates portion control
Eight Practical Portion Control Techniques For UK Kitchens
Eight techniques form the core of a measurement-led system. Each is a discrete, enforceable action that can be implemented and checked.
- Write standardised recipe cards with exact grams and millilitres for every ingredient, including sauces, garnishes and sides.
- Record yield, trim and wastage percentages on every card so portion cost is calculated on served weight, not supplier weight.
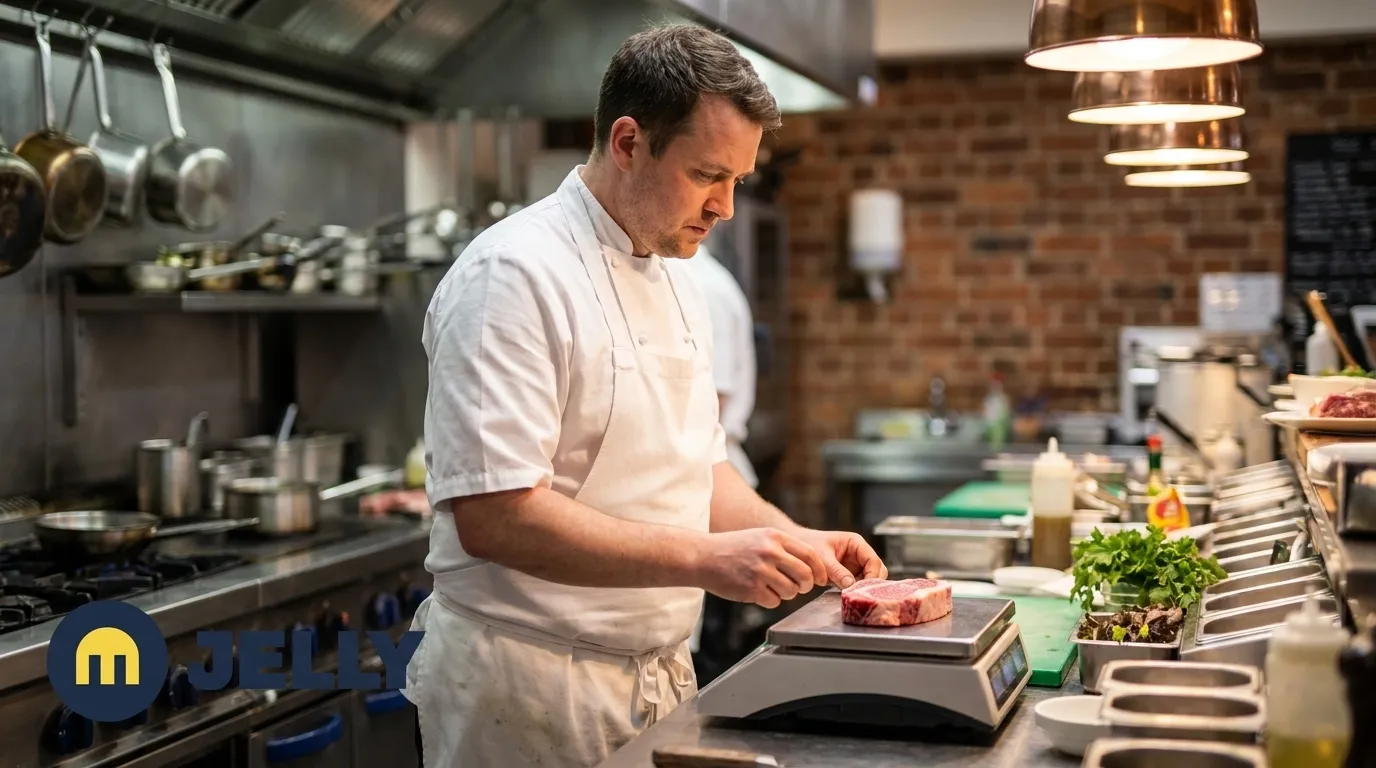
- Weigh high-cost ingredients such as steak, fish, cheese and premium oils on digital scales at the point of plating.
- Use calibrated portioning equipment such as marked ladles, coded scoops, pumps and portion bags.
- Pre-portion during mise en place so cooks grab exact amounts during service.
- Display plated-dish photography at every station as a visual standard.
- Train kitchen and floor staff on how small over-portions compound across covers.
- Audit portions weekly against spec and act on outliers.
Techniques 1–7 establish the standard, and technique 8 keeps that standard in place. Without the weekly audit, the other seven degrade within weeks as standards slip and measurements drift. See the 5 Portion Control Techniques to Reduce Food Waste for additional context on the waste-reduction dimension.
How To Calculate Portion Cost Per Dish
The portion cost formula underpins every pricing and margin decision.
Portion cost = (Supplier price per unit ÷ usable yield) × portion weight
Worked example: chicken breast is purchased at £7.00/kg. With a 65% usable yield, the true cost is approximately £10.77/kg on served weight. A 180g portion therefore costs roughly £1.94. Calculating food cost on raw weight rather than served weight is one of the most common UK costing errors. It understates plate cost on every dish where trimming, butchery or cooking loss applies.
The same logic applies to fish. Fish inflation reached 11.6% in the 12 months to April 2026. A recipe card costed six months ago on raw weight is now doubly wrong because the price has risen and the yield was never factored in. Both errors push costs in the same direction.
This portion cost formula feeds every downstream decision such as menu pricing, variance tolerance-setting and weekly audit thresholds. Recalculate it every time a supplier invoice changes. How To Use Portion Control To Improve Food Cost % explains how this feeds into GP margin management.
Setting Portion Variance Tolerances By Ingredient Type
Once you know the true cost per portion, the next step is deciding how much deviation from spec you can allow before it erodes margin. A tolerance is the acceptable deviation from spec before a portion is flagged for correction. Tolerances must be set by ingredient type, not applied uniformly across the menu.
The recommended tolerances for UK commercial kitchens are:
- Proteins (steak, fish, chicken, lamb): For UK pubs, the recommended portion variance target for proteins such as steaks, fish fillets and chicken breasts is ±5 grams from target weight, tracked as a weekly average per dish. A 20g over-portion on a 180g spec is more than 11% of the portion weight. At £7–£13/kg and above, that variance compounds materially across covers.
- Sauces, dressings and oils: Kitchen management guidance recommends a portion tolerance band of ±5% for proteins and ±10% for garnishes and sauces, with portion spot-checks integrated into daily opening procedures. Cost per gram is moderate, and volume variance is harder to control with ladles. A 10% tolerance is achievable with calibrated equipment.
- Low-cost vegetables, garnishes and starches: In UK commercial kitchens, the recommended portion variance tolerance is within 5% for proteins and within 10% for starches, vegetables and garnishes (with sauces also cited at ±10%). Cost per gram is low enough that tight enforcement adds administrative burden without meaningful financial return.
- Cheese: ±2–3%. The milk, cheese and eggs category posted its highest monthly increase in several months in August 2026, driven by hot, dry weather reducing raw milk availability in Europe. Cheese warrants protein-level tolerance.
- Premium oils (truffle, extra virgin olive): ±2–3%. Cost per millilitre is high, and pump dispensers provide the right control mechanism.
The principle is straightforward. Tighten tolerances where ingredient cost per gram is high, and loosen them where it is negligible. A blanket ±5% across all ingredients misallocates enforcement effort and leaves the highest-cost lines under-controlled.
How To Run A Weekly Portion Audit
A weekly portion audit is a structured, repeatable protocol that follows a defined process. It requires an assigned owner, a clear sample size and a documented outcome.
The protocol runs as follows:
- Select dishes to audit. Prioritise high-cost proteins and any dish where the previous week's audit flagged a variance outside tolerance.
- Weigh 5–10 plates per dish during service. Use a calibrated digital scale at the pass. Record the actual weight against the recipe spec weight.
- Log every variance. Record actual weight, spec weight, variance in grams and variance as a percentage. Note the cook responsible for each plate.
- Compare against tolerances. Flag any plate outside the ingredient-specific tolerance set above.
- Act on outliers immediately. Retrain the individual, recalibrate the portioning equipment or adjust the pre-portioning process. Do not defer action to the following week.
- Assign one owner per service. The audit fails without accountability. One named person, typically the sous chef or kitchen manager, owns the log for each service.
- Review weekly at a fixed time. Compare this week's variance log against the previous four weeks. A recurring variance at the same level is systematic and must be addressed structurally, not through repeated retraining.
The weekly portion audit protocol takes about twenty minutes per service when the equipment and log sheet are already in place, involving weighing a sample of five to ten of each high-volume dish during a normal service. The cost of skipping it appears in the worked example below.
Streamline your weekly audits with Jelly
The Worked £ Example: How Portion Creep Compounds With Supplier Price Rises
To see why the weekly audit matters, consider a single ingredient. Chicken breast at £7.00/kg. Recipe spec: 180g. Actual portion leaving the pass: 200g. That is a 20g over-portion within what many kitchens would consider acceptable eyeballing tolerance.
At 80 covers per week, the weekly over-spend is: 80 × 0.020kg × £7.00 = £11.20/week. Annualised, that is roughly £580 on chicken alone.
Now apply the same logic across a typical menu. A 20g over-portion on beef at £13/kg across 40 covers adds £10.40/week (around £540/year). A 15g over-portion on fish at £12.87/kg across 50 covers adds £9.65/week (around £500/year). A 10g over-portion on cheese at £8/kg across 60 covers adds £4.80/week (around £250/year). Combined, that is in the region of £1,800–£1,900/year from four ingredients, before any supplier price movement.
Beef and veal inflation reached 13.2% in the 12 months to April 2026. Applying a price rise of that order to the beef line above would push the weekly over-spend on beef from £10.40 to around £11.75. It would increase the annual compound loss from that single ingredient alone by roughly £70. Across all four proteins, a blended price rise of around 10% would add roughly £190/year to the portion-creep loss without any change in kitchen behaviour.
A 3% creep in food cost percentage can erase the entire net profit of a UK hospitality venue. Portion creep is one of the primary mechanisms by which that 3% accumulates invisibly.
Measuring Prep, Production And Plate Waste
Portion creep is one source of avoidable cost, and it sits alongside broader waste streams that a complete measurement system must capture. Food waste in a commercial kitchen falls into three distinct categories, each requiring a different intervention:
- Prep waste: Trim, peel and butchery loss. Controlled by yield-accurate recipe cards and supplier-quality standards.
- Production and service waste: Overproduction, mis-fires and batch waste. Controlled by demand-led prep quantities aligned to confirmed covers.
- Plate waste: Food returned uneaten. WRAP's Guardsman analysis found plate waste accounts for around 34% of restaurant food waste by weight, driven by oversized portions, dishes that do not match customer expectations and the absence of a feedback loop between front-of-house and kitchen.
WRAP's Guardsman benchmark for UK restaurants is 18% food waste as a percentage of food purchased. Operators above this benchmark are most likely losing volume to spoilage and overproduction. Those below it may still have opportunity in plate and prep waste.
WRAP's recommended measurement method is a three-day audit. Set up separate labelled bins for spoilage, prep waste, overproduction and plate waste. Weigh each bin at the start and end of lunch and dinner service across three days, then calculate waste as a percentage of food purchased for the same period using invoices. This is the Target, Measure, Act approach that WRAP applies across UK hospitality. One documented operator using a structured measurement system achieved a reduction from 65% to 72% gross profit within 12 weeks on approximately £500,000 in revenue.
Linking Portions To Sales And Stock Data
The weekly audit catches variance at the pass, but it cannot see what happens between goods-in and the pass, nor can it reconcile what the kitchen used against what the POS recorded as sold. That blind spot is where shrinkage and unrecorded over-portioning hide. Invoice-to-plate reconciliation closes it.
The reconciliation works as follows. POS sales mix data shows how many covers of each dish were sold in a given period. Invoice data shows what was purchased. The difference, adjusted for opening and closing stock, is what the kitchen consumed. If consumption exceeds what the sales mix implies at spec weight, the excess is attributable to over-portioning, waste or shrinkage. Without both data streams, the source of the variance remains invisible.
Jelly automates this process. Invoices are scanned automatically, capturing every line item, quantity, SKU and price, and linked directly to recipe costs. As new invoices arrive, dish costs and GP margins update in real time. The Flash Report provides a daily or weekly view of GP margin calculated from live invoice costs and POS sales. Price Alert flags every ingredient price movement the week it happens, not the month after.
POS integration with Square, EPOS Now, Lightspeed and Toast takes under five minutes to set up and feeds item-level sales data directly into Jelly, enabling the sales-mix-to-portion reconciliation that manual systems cannot deliver. Amber restaurant in East London saves £3,000–£4,000 per month through invoice automation, price-change alerts and real-time costing, with Chef-Owner Murat Kilic describing Jelly as what keeps his business alive. Sushi Revolution uses Jelly to manage separate GP targets across dine-in and delivery menus, achieving actual gross profits 2–3% higher on average.
Common Challenges And Pitfalls
The most common failure modes in UK portion control systems are structural:
- Inconsistent data capture. Audit logs are completed for two weeks, then abandoned when service gets busy. The fix is a named owner and a fixed weekly review time.
- Delayed reporting. Monthly P&L data arrives too late to act on portion drift that happened three weeks ago. Live invoice-linked costing removes this lag.
- Overreliance on spreadsheets. Spreadsheets drift, break formula links and are not updated when supplier prices change. A dish costed in January on a static spreadsheet may be significantly mispriced by October.
- Poor adoption. Chefs resist systems that feel like surveillance. Framing the audit as a kitchen efficiency protocol improves uptake.
- Fragmented systems. Invoice data sits in one place, recipe cards in another and POS data in a third. Reconciliation requires all three in the same system.
- Lack of accountability. No named owner means no one acts on outliers. Assign one person per service.
These challenges often stem from systems that were not built for the pace of a commercial kitchen. Other platforms offer broader feature sets but are more complex and slower to onboard. Legacy systems are expensive and static, built for large chains with dedicated office teams. Jelly onboards in the first week at £129/month per location, with POS setup taking under five minutes across all supported systems.
Frequently Asked Questions (FAQ)
What Is The Formula For Calculating Portion Cost?
As explained in the section on calculating portion cost, the formula is (supplier price per unit ÷ usable yield) × portion weight. The critical step is always dividing by usable yield, which is the percentage of the purchased ingredient that actually reaches the plate after trimming, butchery and cooking loss. Focusing on usable yield prevents understated plate costs on dishes where yield loss applies.
What Are The Main Methods Of Portion Control?
The main methods are standardised recipe cards specifying exact grams and millilitres for every ingredient, digital scales used at the point of plating for high-cost ingredients, calibrated portioning equipment including marked ladles, coded scoops and pumps, pre-portioning during mise en place so cooks handle exact amounts during service, and weekly auditing of actual plate weights against recipe spec with documented variance logs. Each method addresses a different point of failure in the kitchen workflow. Used together, they form a closed measurement system.
What Is Portion Control In Cooking?
Portion control in cooking is the standardised measurement of every ingredient that leaves the pass so that the actual plate cost matches the recipe cost on which menu pricing and GP targets are based. It is a measurement discipline supported by repeatable audits and defined variance tolerances. Without that structure, portion control degrades to eyeballing, and eyeballing drifts under service pressure.
How Can You Control Food Costs?
Food cost control requires four connected actions. Standardise every recipe with exact weights and yield percentages. Measure high-cost ingredients at the point of plating using calibrated equipment. Audit portions weekly against spec using a structured protocol with defined tolerances by ingredient type. Reconcile portion consumption against POS sales data and live invoice costs to detect over-portioning, waste and shrinkage. Each step depends on the previous one, and skipping any layer leaves blind spots in the system.
Conclusion: Portion Control As A System
Portion control that works is a measurement system with four components: standard, measure, audit, reconcile. Each component is necessary, and none is sufficient alone. The standard sets the target. Measurement enforces it at the pass. The weekly audit catches drift before it compounds. Reconciliation against live invoice and POS data closes the loop between what was purchased, what was served and what was sold.
Some of the UK's largest restaurant groups are generating profit margins of only around 1.5%, with 23% of UK hospitality businesses operating at a loss. In that environment, portion creep becomes a structural threat rather than a minor operational irritant. As the worked example showed, even small over-portions on a handful of ingredients can add up to thousands in annual losses.
Jelly users cut food costs by 3% on average in the first three months and add 2 percentage points to gross margins. The system automates the reconciliation layer, including invoice scanning, live dish costing, price alerts and POS-integrated sales mix reporting, so portion drift is caught the week it happens, not the month after.
Start cutting food costs with Jelly

